Biomimicry Global Design Challenge 2017
This project is what I researched over the summer. Instead of just looking at the generated formula, I am going to collect data from the legitimate websites and try to plug those numbers into the formula. After plugging those numbers into the formula, I will figure out how much food is needed by 2030.
I will predict the number for 2030, and plug them into the formula.
Top three industries that produce the most CO2:
1. Fossil Fuel Combustion
2. Transportation
3. Heat and Electricity.
Abstract:Top three industries that produce the most CO2:
1. Fossil Fuel Combustion
2. Transportation
3. Heat and Electricity.
There are approximately 200 definitions, and 450 indicators of food security. One of the most precise definitions of food security is "Community food security exists when all citizens obtain a safe, personally acceptable, nutritious diet through a sustainable food system that maximizes healthy choices, community self reliance and equal access for everyone.”(1) Food security can be assessed by precipitation data, food balance sheet, food market survey, and crop production.
China should be more concerned about food security because of its constant increase in population. 1.4 billion out of 7.3 billion people live in China. Since there is a lot of pollution being produced in china, the temperature is increasing, CO2 emission is increasing, crop production is being affected by it. Through MATLAB, we found the correlation of coefficient to predict the crop yield for the future. PDSI stands for Palmer Drought Severity Index.
PDSI has a standardized scale that is used to determine the severity of the region. It ranges from -4 to +4, towards -4 meaning dry condition, and towards +4 meaning wet condition. “Drought is a deficiency in precipitation over an extended period, usually a season or more, resulting in a water shortage causing adverse impacts on vegetation, animals, and/or people.”(8)
Introduction:
Every country in the world is known for the major crops it produces. In this project, the main focus is on China’s six main crops: wheat, rice, sorghum, soybean, maize, and barley. Climate Change has a huge impact on crop production. Food Security is the main focus for the present world and for our future generations. The world population has increased drastically in the last few years and is expected to reach 9 billion by 2050. There are numerous people in the world who go to bed without eating anything, not because there isn’t enough food for them, but it’s because the food is not accessible to them, and there is too much competition in the market world.
Crop Production in China has increased exponentially from 1961-2011. Along with the increase in crop production, temperature has also increased to a level that can impact the entire globe instantly. Regions inadequate for farming might be able to grow crops in the future if the temperature keeps increasing. Most farmers are affected by the crop production because until the mid 1990s, China’s agriculture required the farmers to pay taxes. Because China is overpopulated, food security is a big concern for China. Consumers spend a large portion of their income on food, rural people earn half the amount from farming, and if China started importing more food, it will affect the entire world, especially countries living in poverty.
Climate change has an impact everything, especially temperature, crop production, CO2 emission and precipitation level. There is a huge misconception about CO2 emission. Many assume that CO2 emission is unhealthy for the crop production, but instead CO2 emission is an enrichment for the crops. China suffers from severe drought every year. Droughts have had a huge impact on the crop production.

Methodology :
Precipitation, temperature, technology enhancement, and CO2 emission data were acquired from FAO database 1961-2012 for China. The data started from 1961 because the FAO website started recording yield data from 1961. Climate change is impacting the temperature, precipitation, CO2 emission, and technology.
Furthermore, this affects food security. To see the relationship between all the variables, we used MATLAB, and found the coefficient correlation. ArcMap was used to determine NDVI average data from the NASA website NDVI stands for Normalized Difference Vegetation Index. “The Normalized Difference Vegetation Index (NDVI) is a numerical indicator that uses the visible and near-infrared bands of the electromagnetic spectrum, and is adopted to analyze remote sensing measurements and assess whether the target being observed contains live green vegetation or not.(3)” We relied on remote sensing for our data.

Generated Formula:
Log(yield)= a + b1*Precipitation + b2*Temperature + b3*CO2 + b4*Technology
Data:
Precipitation Data was gathered from World Bank(4). Average CO2 Emission was collected from the NOAA website(8). ENSO data was obtained from the World Bank(4). Crop Yield for all the main crops was gathered from FAO website(7). To see a change in technology, we made a vector using the years 1961-2012. Average NDVI data was obtained from the NASA website(9).

1995: 360
2000: 370
2005: 380
2010: 390
2015: 400
2020: 410
2025: 420
2030: 430

1995:
2000:
2005:
2010:
2015:
2020:
2025:
2030: 49.5

1995:6.8
2000:6.8
2005:7
2010:7
2015:
2020:
2025:
2030: 8

1990: 46,000
1995: 50,000
2000: 48,000
2005: 56,000
2010: 54,000
2015: 56,000
2020: 55,000
2025: 58,000
2030: 65,000
Soybeans:
1990: 14,000
1995: 18,000
2000: 17,000
2005: 17,000
2010: 19,000
2015: 20,000
2020: 19,000
2025: 20,000
2030: 21,000
Rice:
1990: 58,000
1995: 61,000
2000: 61,000
2005: 61,000
2010: 66,000
2015: 72,000
2020: 74,000
2025: 76,000
2030: 80,000
Sorghum:
1990: 38,000
1995: 30,000
2000: 30,000
2005: 45,000
2010: 40,000
2015: 46,000
2020: 43,000
2025: 50,000
2030: 52,000
Barley:
1990: 29,000
1995: 27,000
2000: 25,000
2005: 40,000
2010: 39,000
2015: 40,000
2020: 41,000
2025: 41,000
2030: 46,000
Wheat:
2030: 70,000
Results:
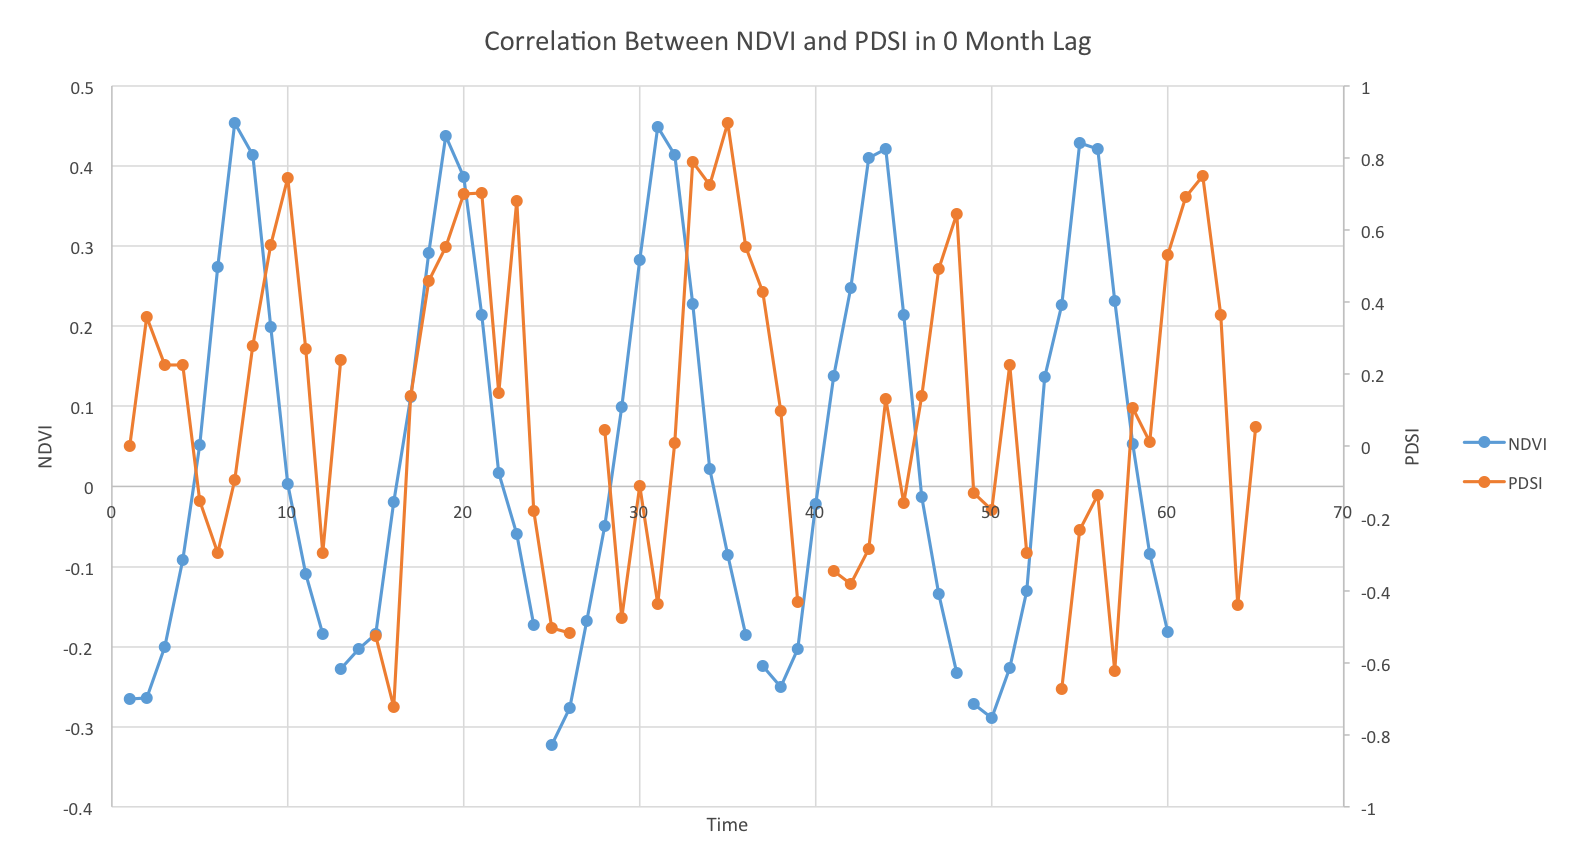
The
graph below illustrates that a drought has an immediate effect on the crop
production of China. 0 Month Lag had the strongest relationship compared to the
1, 2 and 3 Month Lag. The correlation between NDVI and PDSI in 0 Month Lag was 0.688,
1 Month Lag was 0.525,
2 Month Lag was 0.219, and finally 3 Month Lag was -0.120.
Looking at figures 1,2,3, and 4 precipitation, CO2 emission, temperature, and
crop yield in the graphs above, it is clear that they all go up and down, but
mostly increase from 1961-2012. The coefficients of the crop yield equation are
the following: b1= -0.004764442104632809,
b2= 0.006878378588643539, b3=0.002832575142712707, and b4=
0.001118322107259302.
Log(yield)= a + b1*Precipitation + b2*Temperature + b3*CO2 + b4*Technology
2016 log(yield) = (-0.004764442104632809)*(50) + (0.006878378588643539)*(7) + (0.002832575142712707)*(400) + (0.001118322107259302)*() + a
2030 log(yield) = (-0.004764442104632809)*(49.5) + (0.006878378588643539)*(8) + (0.002832575142712707)*(430) + (0.001118322107259302)*() + a
Procedure to get the NDVI averages.

Conclusion:
To conclude, based on the relationship between NDVI and PDSI, it is quite obvious that crops are healthy when there are less droughts. When a drought occurs, it has an immediate effect on the crops of China. When the NDVI number is high, the PSDI number is also high. Besides that relationship, through MATLAB we also found a strong relationship between precipitation, CO2 emission, temperature, technology, and crop production. We developed an equation to predict our future crop yield based on the temperature, precipitation, CO2 emission, and technology.
In order to feed its population, China should be producing more crop yield, and this research could be enhanced in the future by comparing more than six crop major crops, and more years could be used for the NDVI averages to look at the vegetation health of crops in China.
No comments:
Post a Comment